Debugger Stack and Frames
The list of frames displays the current call stack. A single element, i.e. a line in the screenshot, is called a “frame”. The first element is the top frame. Each frame represents an invocation of a function or a script.
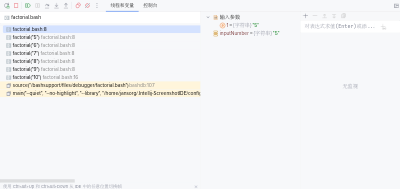
The background color of a frame signals its type:
- a colored background tells you that its source is located in the bashdb sources. This is outside your script.
- a transparent background tells you that it’s your own script

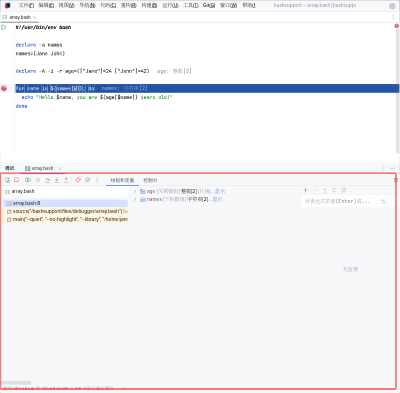
Variables View
The variables view displays variable names and values.
A click on a frame updates the variables view on the right:
The top frame supports these elements:
- the arguments to the function or script of the frame
- the available variables and values
All other frames only support the list of arguments, i.e. they do not support the list variables.
Variable Type
- Array and associative array
- Arrays and associative arrays (aka maps) can be expanded to display the contained elements line by line.
Elements of an array and an associative array - Number
- Variables declared via
declare -iorlocal -iare integers, values are displayed as numeric values. - String
- All other variables are of type
String, the values displayed in quotes.
How to View All Available Variables
By default, only the variables modified by your script are displayed. A snapshot of all available variables is captured before the script is executed. Variables, which still have their initial values, are hidden with the default settings.
You can configure the view to display all available variables:
- Click on the gear symbol on the left of the list of frames
- Check the option
Show environment variables.